

 Trade W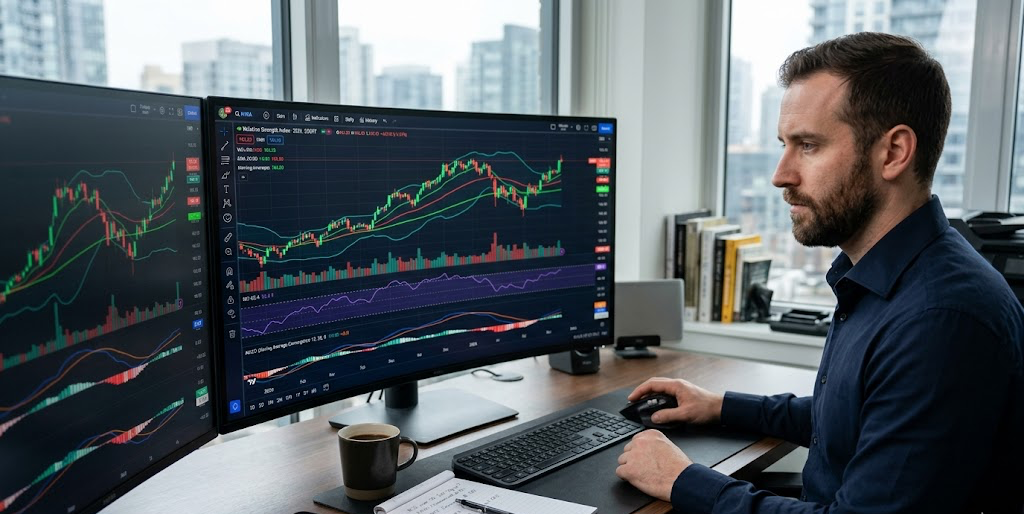
Traders on Wall Street often follow a systematic, rules-based approach because of the high degree of uncertainty involved in financial markets. Technical indicators convert raw price and volume data into information that traders can use to make decisions. They take raw price and volume data and turn it into something a trader can actually act on, whether the plan is a quick day trading session or a position held for weeks. Successful stock traders are not necessarily those with the strongest intuition; rather, they tend to develop structured processes based on technical indicators, test those processes over time, and remain disciplined enough to determine what works consistently for their trading style.
This book explains the most commonly used technical indicators for stock trading in 2026, how each indicator is constructed, and how multiple indicators can be combined to reduce the impact of false signals. It also examines the most appropriate time frames for different indicators, highlights common mistakes that can lead to trading losses, and provides practical examples based on recent market activity.
What are technical indicators in stocks?
An indicator is a mathematical calculation based on price, volume, or a combination of both that produces a value or line intended to highlight aspects of market activity that may not be immediately visible on a raw price chart.
For example, a moving average smooths price data to help identify the overall direction of a trend. The Relative Strength Index (RSI) measures the speed and magnitude of recent price movements. Volume indicators measure the number of shares traded during a given period and can provide insight into the strength of a price move. It helps to separate price action from indicators here. Price action trading reads the candles and the bar chart directly, with no calculations layered on top.
One way to accomplish this is through the use of indicators. Traders receive raw market price data, process that data using indicators, and generate signals that can be displayed on their charts. Both approaches can be effective, which is why many experienced traders use a combination of raw price analysis and technical indicators.
Indicators can also be divided into two broad categories based on how they function: leading indicators and lagging indicators. Leading indicators attempt to provide signals before a price movement occurs and are therefore often more sensitive and prone to false signals. Lagging indicators, by contrast, confirm a price movement after it has already begun, helping traders identify established trends.
The Relative Strength Index (RSI) is commonly classified as a leading indicator, while moving averages are generally considered lagging indicators. Traders should understand whether an indicator is being used as a leading or lagging tool so that it can be incorporated appropriately into their trading decisions.
Types of stock trading indicators: trend, momentum, volatility and volume
Indicators are generally grouped into four categories, each providing specific information about market behaviour. The first category consists of trend indicators, which are designed to identify the direction of price movement. Examples include moving averages and trendlines. These tools are typically classified as lagging indicators because it may take several price bars for a trend to become established. As a result, they generally confirm a change in direction only after the move has already begun, often requiring three to five price bars before confirmation occurs.
The second category consists of momentum indicators, which measure the speed at which prices are moving upward or downward. Examples include the RSI, MACD, and Stochastic Oscillator. These indicators help traders assess whether the momentum behind a price movement is strengthening or weakening. As a result, they can often provide an early warning that a trend is losing momentum before the price itself begins to reverse.
The third category consists of volatility indicators, which measure the extent of price fluctuations over a given period. Bollinger Bands are a common example. They expand during periods of increased volatility and contract when market conditions become more stable.
Finally, the fourth category consists of volume indicators, which measure the level of trading volume activity behind a price movement. These indicators are often used to help confirm whether a trend is likely to continue. For example, if volume increases as prices rise, this may confirm the upward move. Conversely, if volume declines while prices continue to rise, it may suggest weakening participation and indicate that the trend is becoming less sustainable.

Driving directions on a road trip provide a useful analogy for understanding technical indicators. The trend tells you which direction you are travelling. Momentum indicates how quickly you are moving. Volatility reflects how smooth or rough the road conditions are. Volume helps determine whether there is enough participation from other market participants to support the route you are taking. A trader who relies on only one of these categories of indicators is effectively driving with three of the four gauges covered, making it more difficult to make informed decisions about market conditions.
Best technical indicators for stocks in 2026
Moving averages (SMA and EMA) for trend identification
Moving averages, including both Simple Moving Averages (SMAs) and Exponential Moving Averages (EMAs), are used by traders to help identify the overall trend direction of a stock by filtering out the day-to-day price fluctuations that would otherwise be considered market noise. Many traders prefer EMAs for shorter timeframes because they place greater weight on recent price data, making them more responsive to current market conditions. In contrast, SMAs tend to provide a more stable representation of price movement over longer periods.
Both SMAs and EMAs can also function as dynamic support and resistance levels, as prices often react to commonly watched moving averages such as the 50-day and 200-day averages during established trends. One of the most widely followed signals on Wall Street is the golden cross, which occurs when a shorter-term moving average crosses above a longer-term moving average. This signal is generally viewed as confirmation of an existing trend rather than a predictor of future price direction. Therefore, moving average crossovers are most effective when used alongside other technical tools to help confirm entry and exit decisions.
MACD: momentum and trend confirmation in one tool
The Moving Average Convergence/Divergence (MACD) indicator combines two Exponential Moving Averages (EMAs) into a primary line. A secondary signal line is then applied to the MACD line, and a histogram displays the difference between the two lines. When the MACD line crosses above the signal line, it is generally interpreted as a sign that bullish momentum is developing. If the histogram bars begin to shrink while the price continues to move higher, a divergence may be forming. Traders often monitor such divergences closely because they can occur before a trend reversal.
The value of the MACD lies in its ability to function as both a trend indicator and a momentum indicator simultaneously. This combination makes it one of the more versatile technical indicators available to traders.
RSI: spotting overbought and oversold conditions
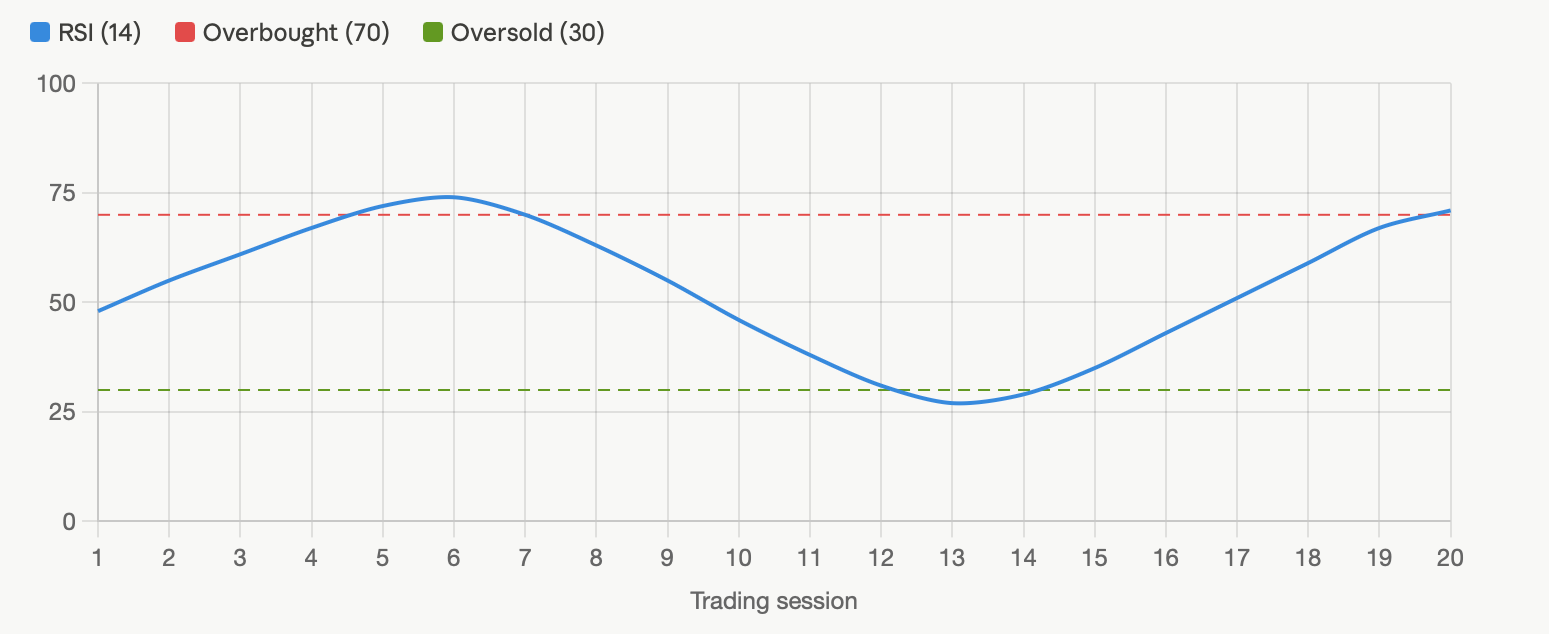
The Relative Strength Index (RSI) measures the speed and magnitude of recent price changes on a scale from 0 to 100. An RSI reading above 70 is generally considered to indicate that a security is overbought, while a reading below 30 is generally considered to indicate that a security is oversold. However, during strong trends, RSI readings can remain above 70 or below 30 for longer than many new traders expect.
One of the most reliable signals provided by the RSI occurs when an asset's price continues to make new highs while the RSI fails to do so. In this situation, bullish price action may continue to develop on the chart, but momentum is weakening beneath the surface. This type of divergence often serves as an early warning that a trend may be losing strength before an actual price reversal occurs.
Bollinger Bands for volatility breakouts
Bollinger Bands consist of two bands plotted around a moving average, or centre line, and are used to help determine the volatility of an asset. The distance between the Bollinger Bands expands and contracts based on market volatility. When the distance between the bands becomes narrow, and the price of an asset approaches one or both bands multiple times, it may indicate that a breakout is likely to follow.
Learning how to identify and interpret a Bollinger Band squeeze setup and breakout is an important step before trading these types of systems in a live market environment.
Stochastic oscillator for short-term reversal timing
The Stochastic Oscillator is used to identify potential short-term trend reversal points by determining whether the closing price of an asset is near the upper or lower end of its recent trading range. The indicator compares the current closing price to a defined price range over a specified period, helping traders assess momentum and potential turning points in the market.
The Stochastic Oscillator is often used in conjunction with other technical indicators and chart patterns, including reversal patterns such as the inverse head and shoulders. When both the Stochastic Oscillator and another technical tool indicate the same directional bias, traders may use that confluence as additional confirmation for a trade entry.
How to combine technical indicators for higher accuracy
There will always be some degree of error when relying on a single indicator. Every indicator has inherent limitations and blind spots. For example, the RSI can remain in overbought territory for extended periods when a strong trend is in place. Similarly, moving averages are inherently lagging indicators and often generate signals only after a significant portion of the price movement has already occurred. The solution is not to search for a perfect indicator, but rather to use multiple indicators that can confirm one another before a trading decision is made.
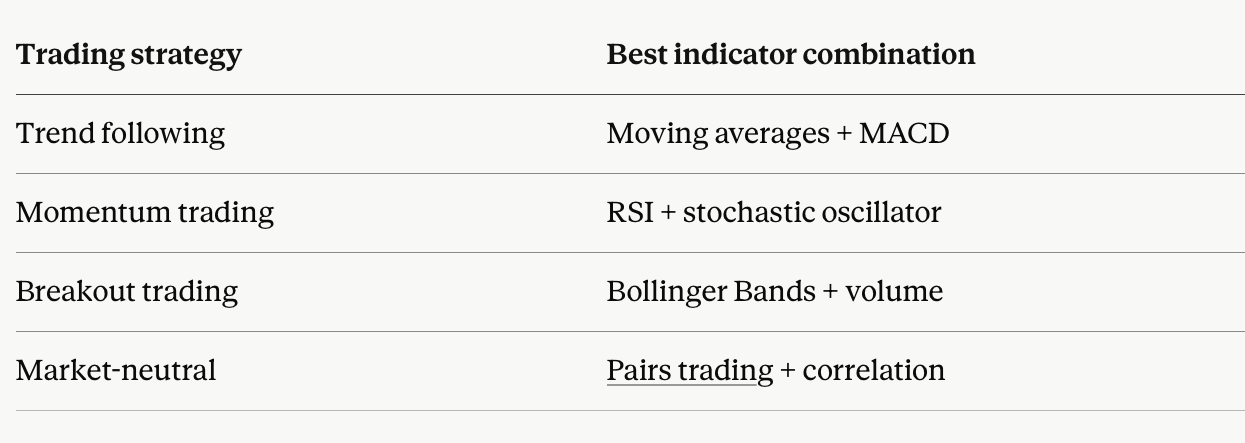
As a general rule, traders should combine indicators from different categories. For example, a trend indicator may be used alongside a momentum indicator, or a volatility indicator may be paired with a volume indicator. This approach is generally more effective than combining several indicators from the same category that measure similar market characteristics. Two momentum indicators generating the same signal should not necessarily be viewed as confirmation, since many momentum indicators are constructed using similar inputs and therefore tend to move in the same direction.
Best indicators for day trading vs swing trading stocks
The indicators you use in your trading will largely be determined by your trading style, whether you are a day trader or a swing trader, and by the time frame on which you trade. For example, if you are a swing trader using a daily chart but applying indicators designed for short-term trading, you may find yourself getting chopped up by market noise. The responsiveness of your indicators should align with the duration of your trades.
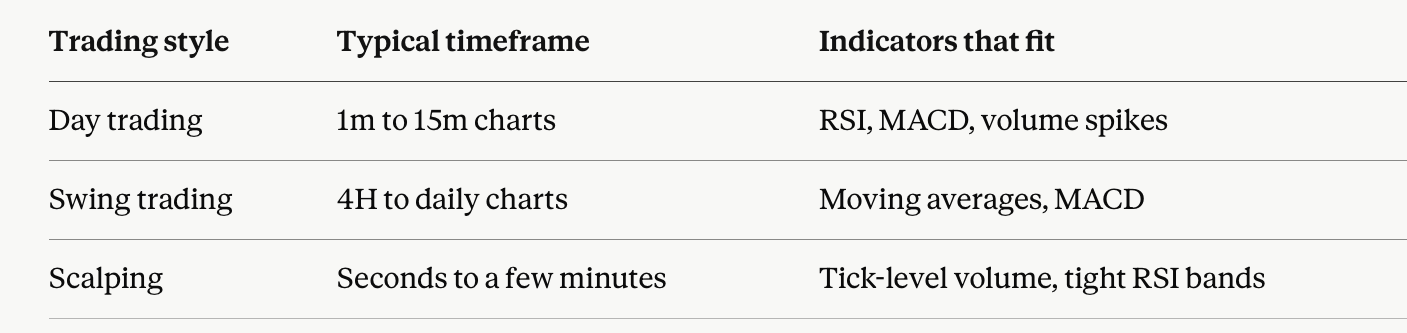
Day traders generally require indicators that react quickly because their trades may last only a few minutes or even seconds. Indicators with significant lag may not provide signals quickly enough to be useful in such environments. In contrast, swing traders can often use slower and smoother indicators because they hold positions over multiple trading sessions and do not need to react to every short-term price fluctuation.
For more details on the differences in trade execution and timing between various trading styles, refer to the guide on day trading strategies for 2026, which examines trade entry and exit techniques as well as position-sizing considerations in greater detail.
Top mistakes traders make when using technical indicators
One of the biggest mistakes traders make is treating a single indicator as the absolute truth and ignoring everything else the chart is communicating. Another equally common mistake is forgetting that most indicators are lagging tools, meaning they react more slowly than real-time price action. This often leads to frustration when traders receive a signal after a significant portion of the move has already occurred. Furthermore, overtrading based on false signals is also a major mistake, particularly during choppy, range-bound market conditions, where different indicators may generate contradictory signals within a short period.
Another less obvious but important mistake is failing to compare analysis across multiple timeframes. For example, a stock may appear bullish on a daily chart while appearing bearish on an hourly chart. If a trader considers only the daily timeframe, they may enter a position based on a signal that does not align with shorter-term market conditions. In addition, leverage can amplify the consequences of these mistakes, as losses resulting from a misinterpreted signal are magnified in the same way that gains are amplified when trading CFDs.
Finally, it is worthwhile to study the common mistakes around overbought signals. Many traders have sold a stock simply because its RSI crossed above 70, only to watch the stock continue rising significantly afterwards.
Using technical indicators on real trading platforms
Most traders perform this kind of analysis on TradingView and MT4/MT5, where they can add and overlay indicators on live charts in a couple of clicks. The typical workflow for many traders looks like this: learn how to use an indicator, test it on historical charts, trade it on a demo account, then trade it live only after establishing an edge from numerous trades that are consistent over time. Many traders who skip the demo trading phase are disappointed to find out that the indicator-based system they thought had some merit during backtesting didn't produce the same results during live trading. Additionally, stay alert and know how to identify a trading signal service that provides indicator-based signals but doesn't share its overall performance, as there are a large number of services operating in that space, and they tend to have a lot more noise compared to other types of services.
Real trading examples using RSI, MACD and Bollinger Bands
Several tech stocks listed on the NASDAQ exchange experienced a pullback in price and maintained a bearish bias as they were in the process of completing a price reversal, while their RSI indicators were making lower lows, indicating a bullish divergence on their respective charts. Some stocks, such as AAPL (Apple), have used MACD crossovers to continue holding long positions through dips rather than exiting after each pullback. For instance, as TSLA (Tesla) moved into higher levels of volatility with price breaking out after a consolidation period, further increases in upside volatility that have not yet occurred could allow for greater profit potential in these stocks through the use of MACD.
Similar signals can be created from candlestick patterns, and their corresponding signals can have a greater degree of corroboration when a trader observes two or more signals occurring during the same period. For example, a hammer candlestick occurring at an oversold level would confirm both candlestick and RSI signals as corroborating indicators; conversely, a double top with a bearish divergence would show that both candlestick and MACD signals confirm each other. Using a simple moving average crossover strategy on a small demo trading account can help create the same habits, and adding RSI during demo trading would allow new traders to eventually build confirmation into their strategy by incorporating an oscillator later on.
Risks of relying on technical indicators
While indicators provide information based on previous price action, they cannot predict future price movements, regardless of how clear a chart may appear after the fact. Lagging indicators may not provide timely signals in fast-moving markets, false breakouts may trigger stop-loss orders just before the actual move occurs in opposition to the prior trend, and emotional overtrading resulting from a series of losses can reverse weeks of disciplined gains in a single session. CFD leverage compounds these risks, and there are numerous events that may cause price movements well outside the technical ranges observed at any given time. Familiarising yourself with how true black swan events deviate from the assumptions that form the basis upon which price movements are identified may be beneficial as a reality check before risking substantial funds on any of the indicator-based systems mentioned.
Final thoughts: strategy matters more than any single signal
There is not a single best technical indicator for stocks in 2026, and chasing after a particular one would be meaningless. Successful long-term traders develop a consistent process through the combination of a trend indicator and a momentum indicator, considering the timeframe when setting their trades, then sizing their positions so that no single signal will ruin their week. They do this by practising on actual charts until they stop seeing signals as noise. Real alpha requires this type of repetition rather than simply using a lucky indicator setup.
Open a TradeWill demo account and drop RSI, MACD, or a Bollinger Band overlay onto a live stock chart right now. Watching a real signal fire in real time will teach you more in an afternoon than this guide alone ever could.
Disclaimer: The content of the blog does not represent any position of Trade W, does not serve as any trading-related decision advice, and does not endorse any third-party.